Skip to content

The platform · six sample screens

How we work with you, from the inside.

All the work runs through our own platform. These screens are diagrams with fictional data: they explain how each part works and show only what exists today.

01 · Account record

Every company, with the reason in view.

A record gathers what we know about a company and where it comes from. The pattern is always the same: what was detected, in which source, on what date. Activity is logged below, in order.

What the team doesReviews the signals and writes the note explaining why it's a fit.
What you do or seeYou read the reason before anyone gets a message.
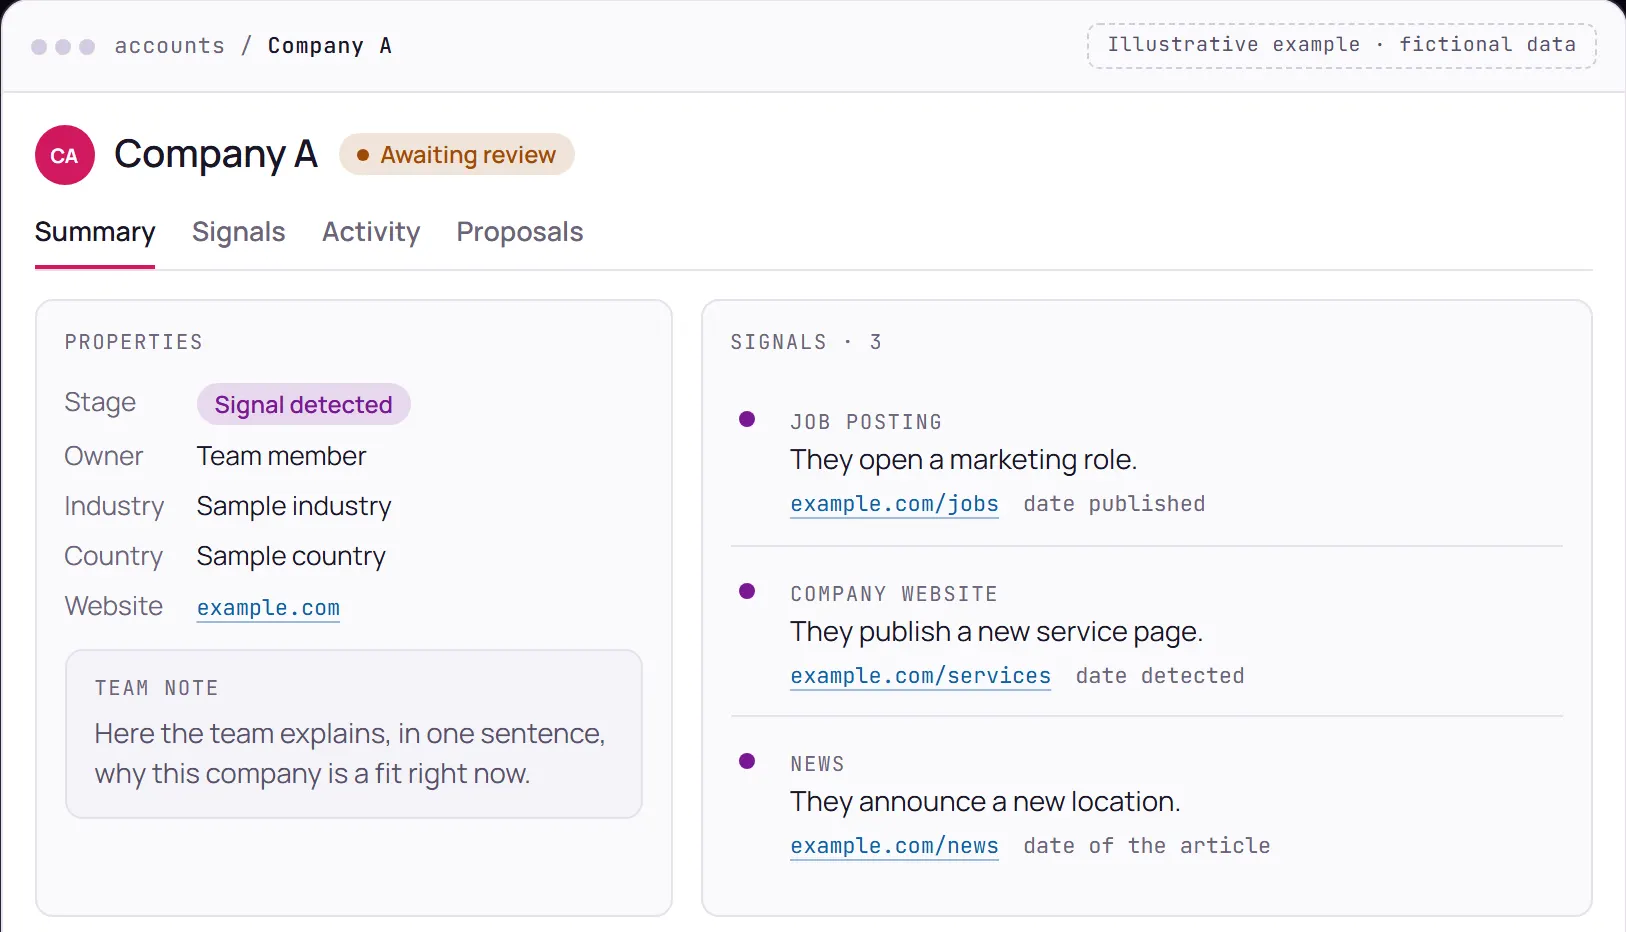
Illustrative example of an account record: company properties, three signals with source and date, and activity in order. Fictional data.Illustrative example of an account record: company properties, three signals with source and date, and activity in order. Fictional data.
Screen 01 · Account recordIllustrative example · fictional data

02 · Review queue

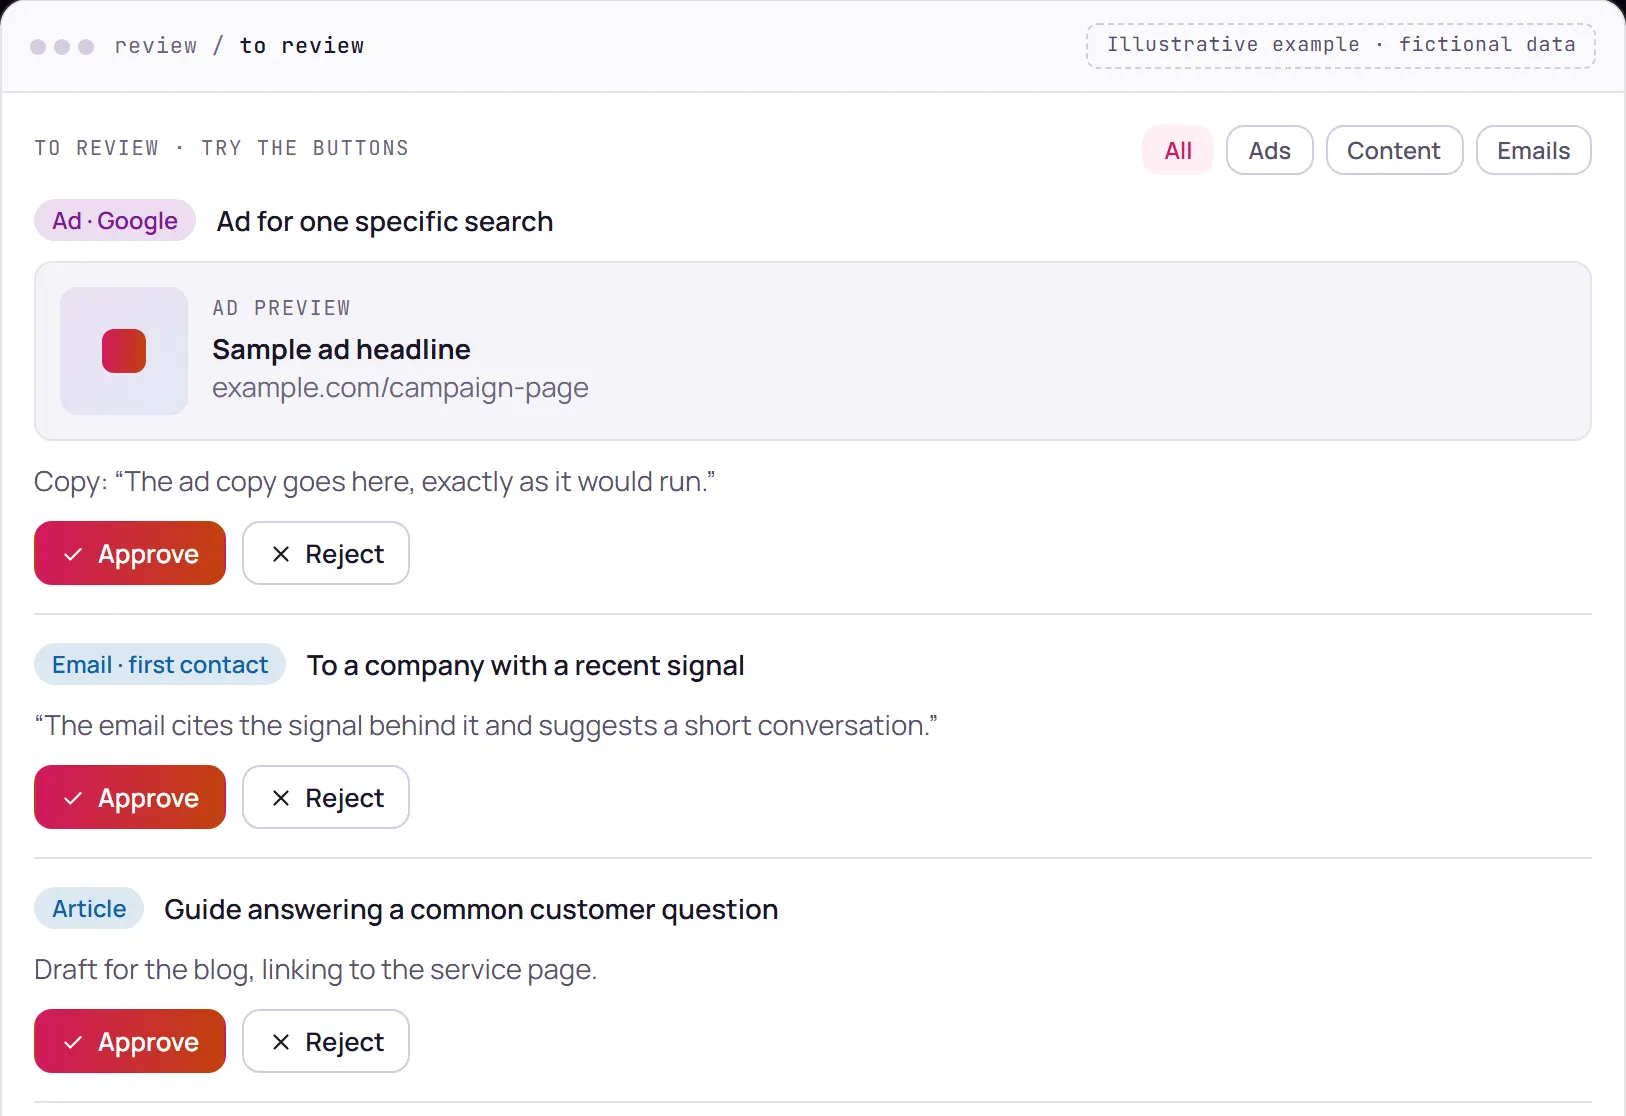
A queue where what goes out is approved.

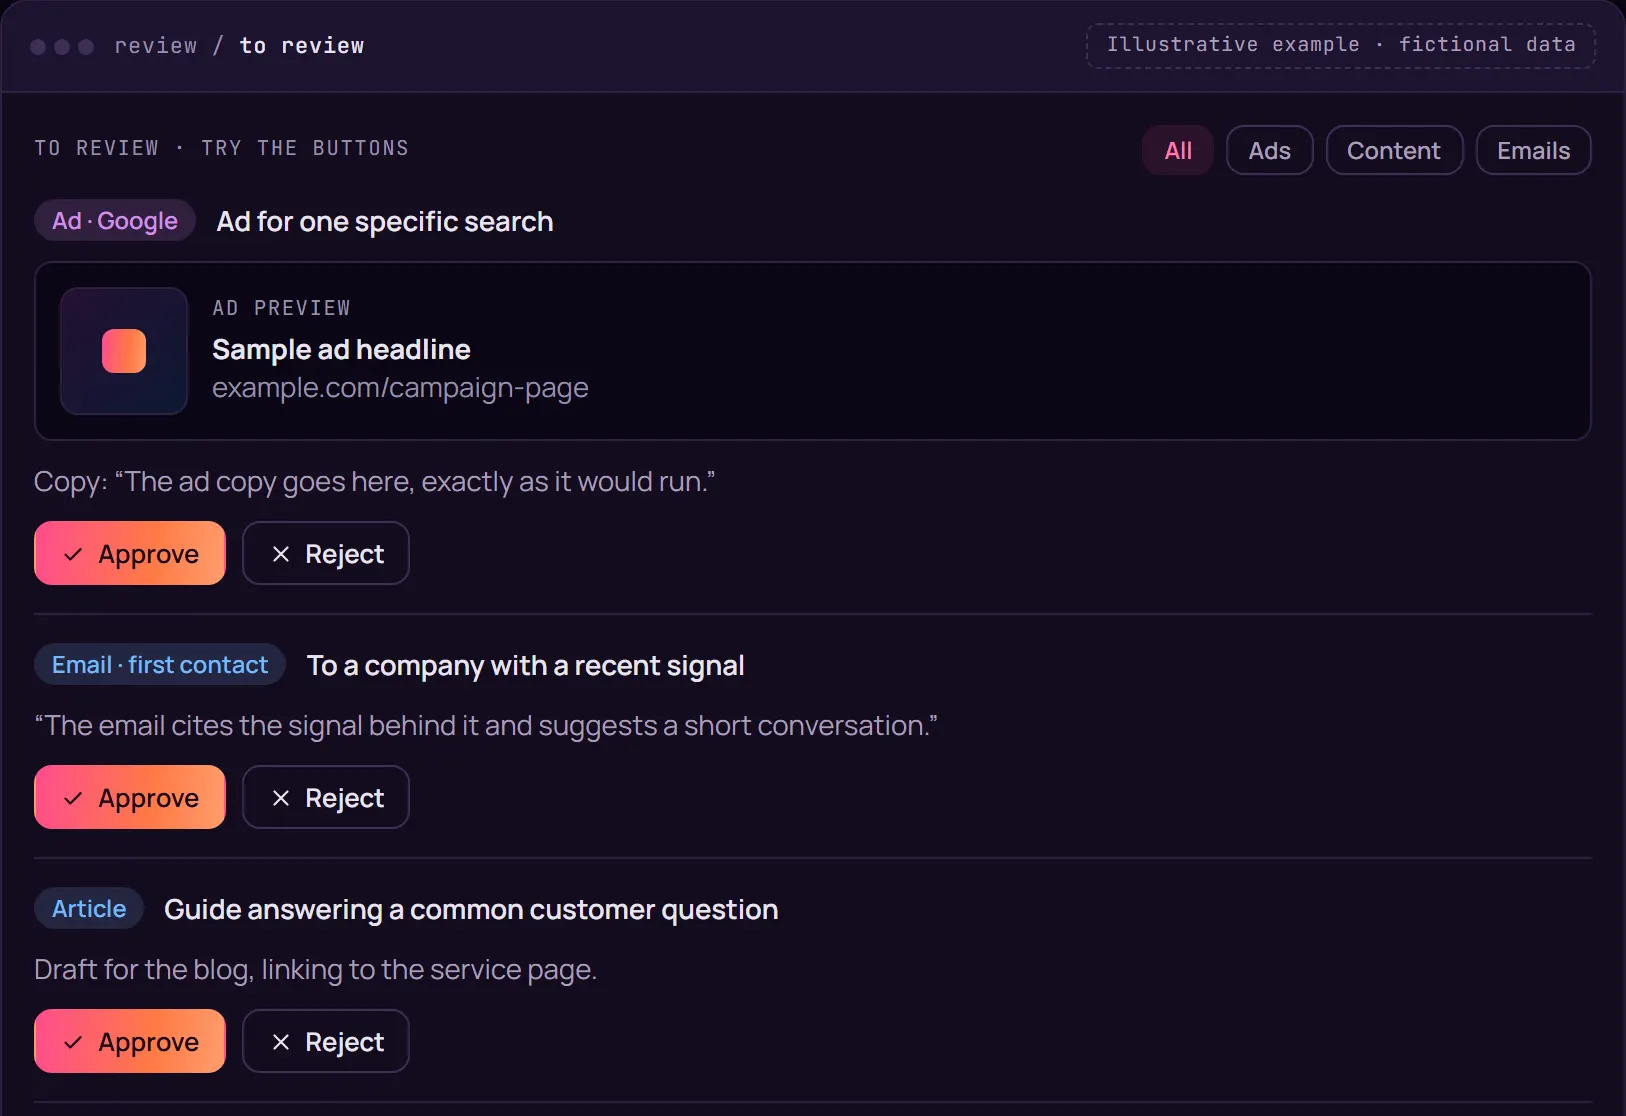
Ads, articles, posts and emails can go through a review queue, where a person approves or rejects each piece.

What the team doesPrepares each piece and leaves it ready for review.
What you do or seeWith review switched on, you approve or reject anything that carries your name, with your point of contact.
Screen 02 · Review queueIllustrative example · fictional data

03 · Pipeline by stage

Every contact, in its stage.

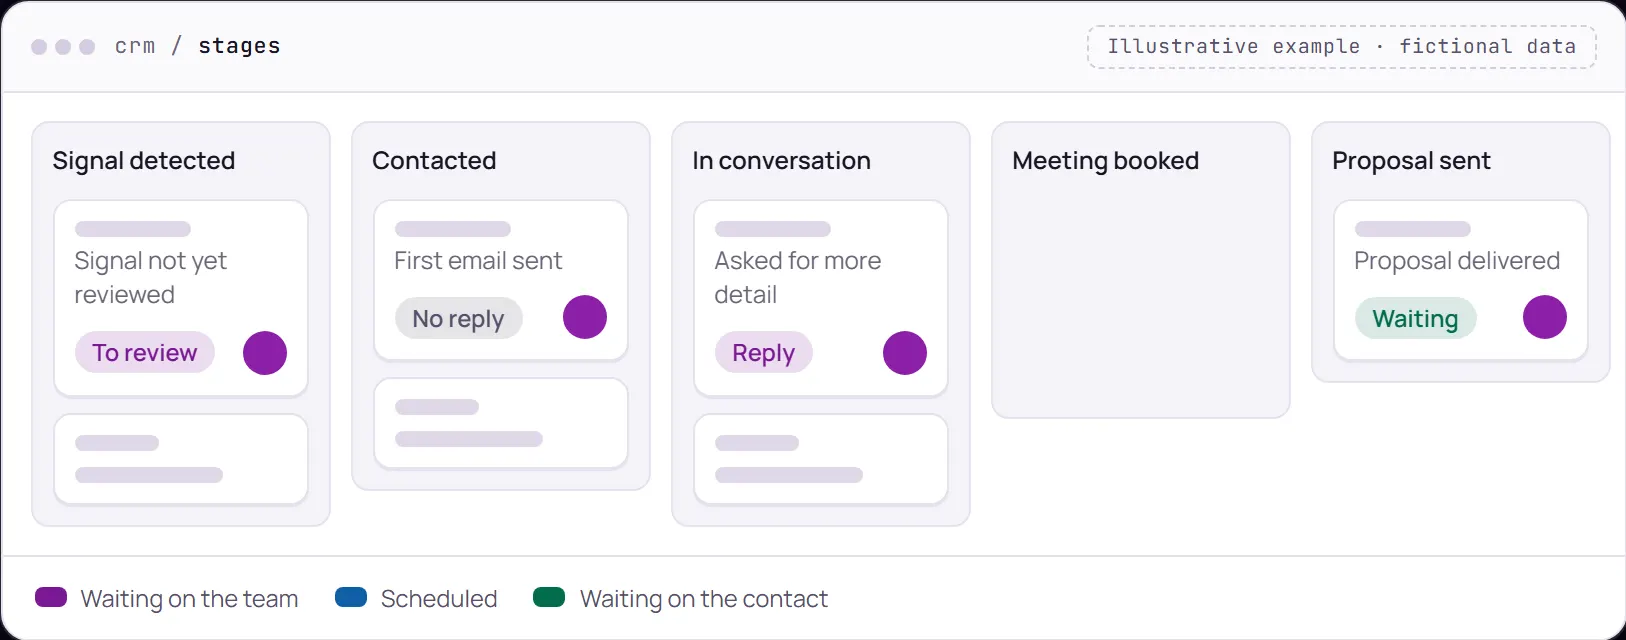
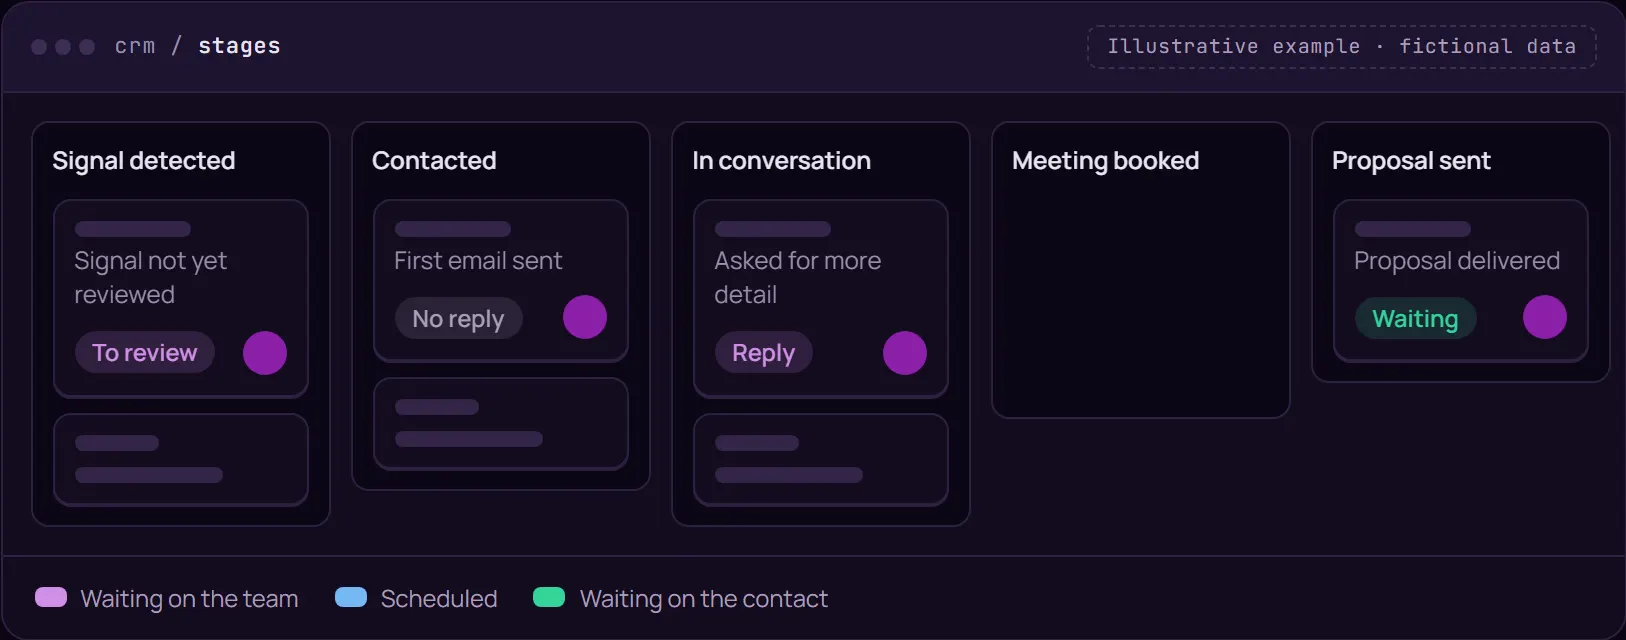
Companies move across columns, from first signal to proposal. At a glance you can see what's stalled and whose move it is.

What the team doesMoves each contact from stage to stage and notes the next step.
What you do or seeYou know where every conversation stands.
Illustrative example of the pipeline by stage: five columns, from signal detected to proposal sent, with the companies in each stage. Fictional data.Illustrative example of the pipeline by stage: five columns, from signal detected to proposal sent, with the companies in each stage. Fictional data.
Screen 03 · Pipeline by stageIllustrative example · fictional data

04 · Booking calendar

The other person picks the time.

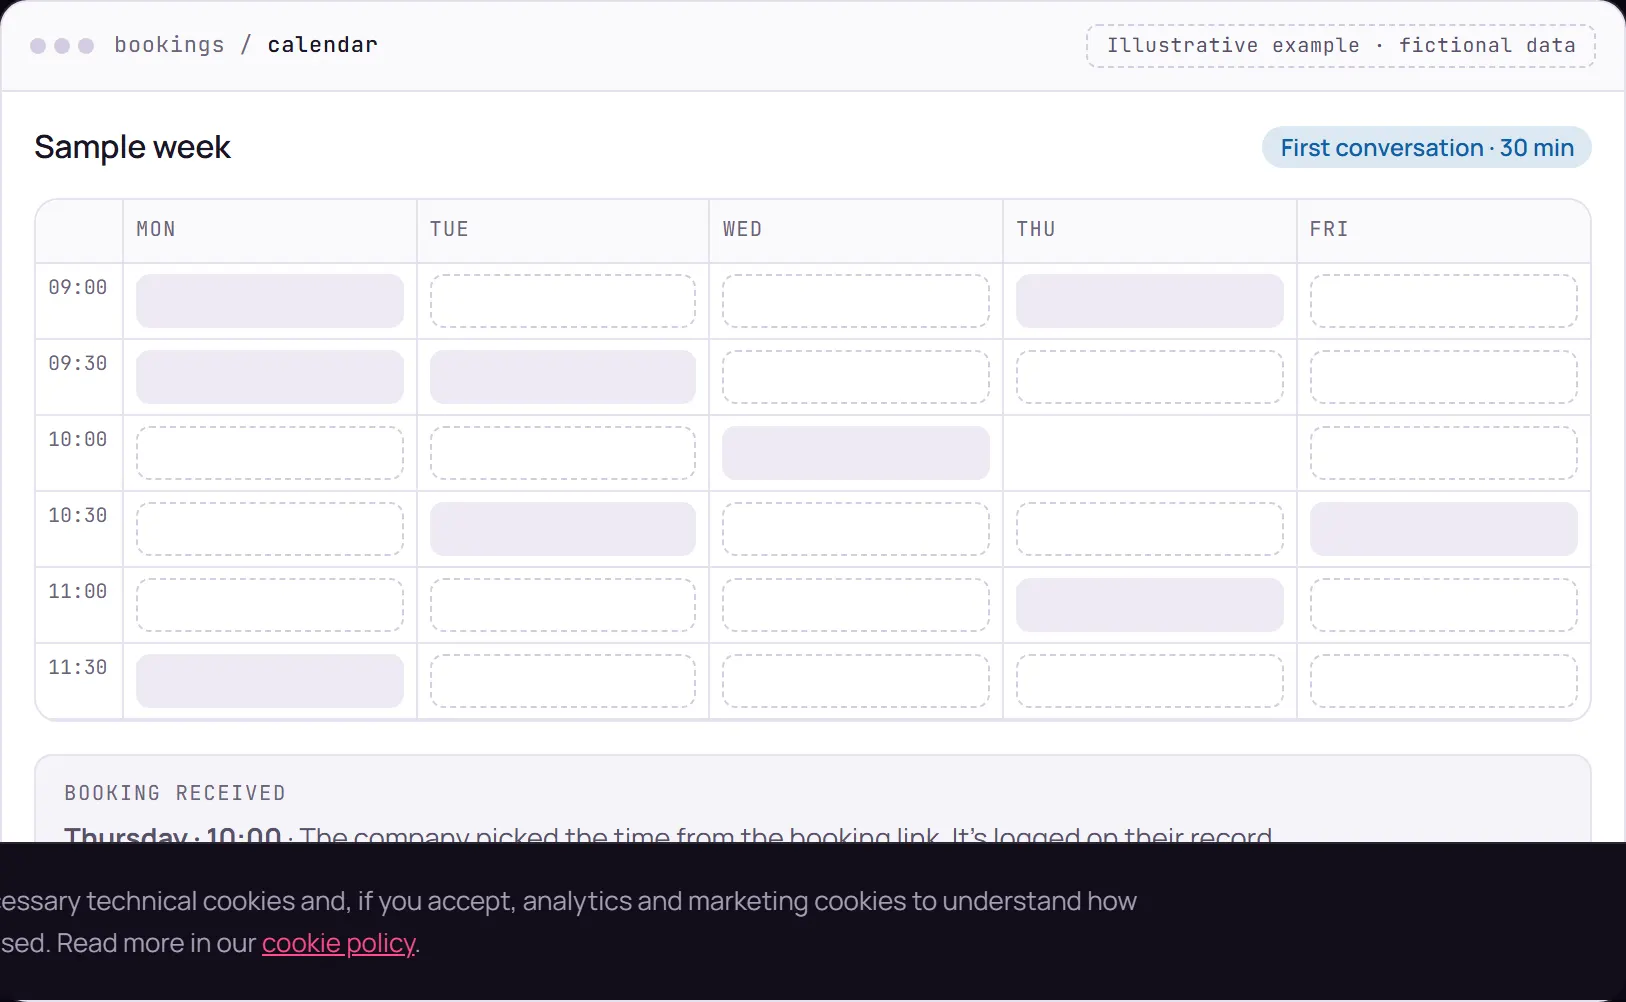
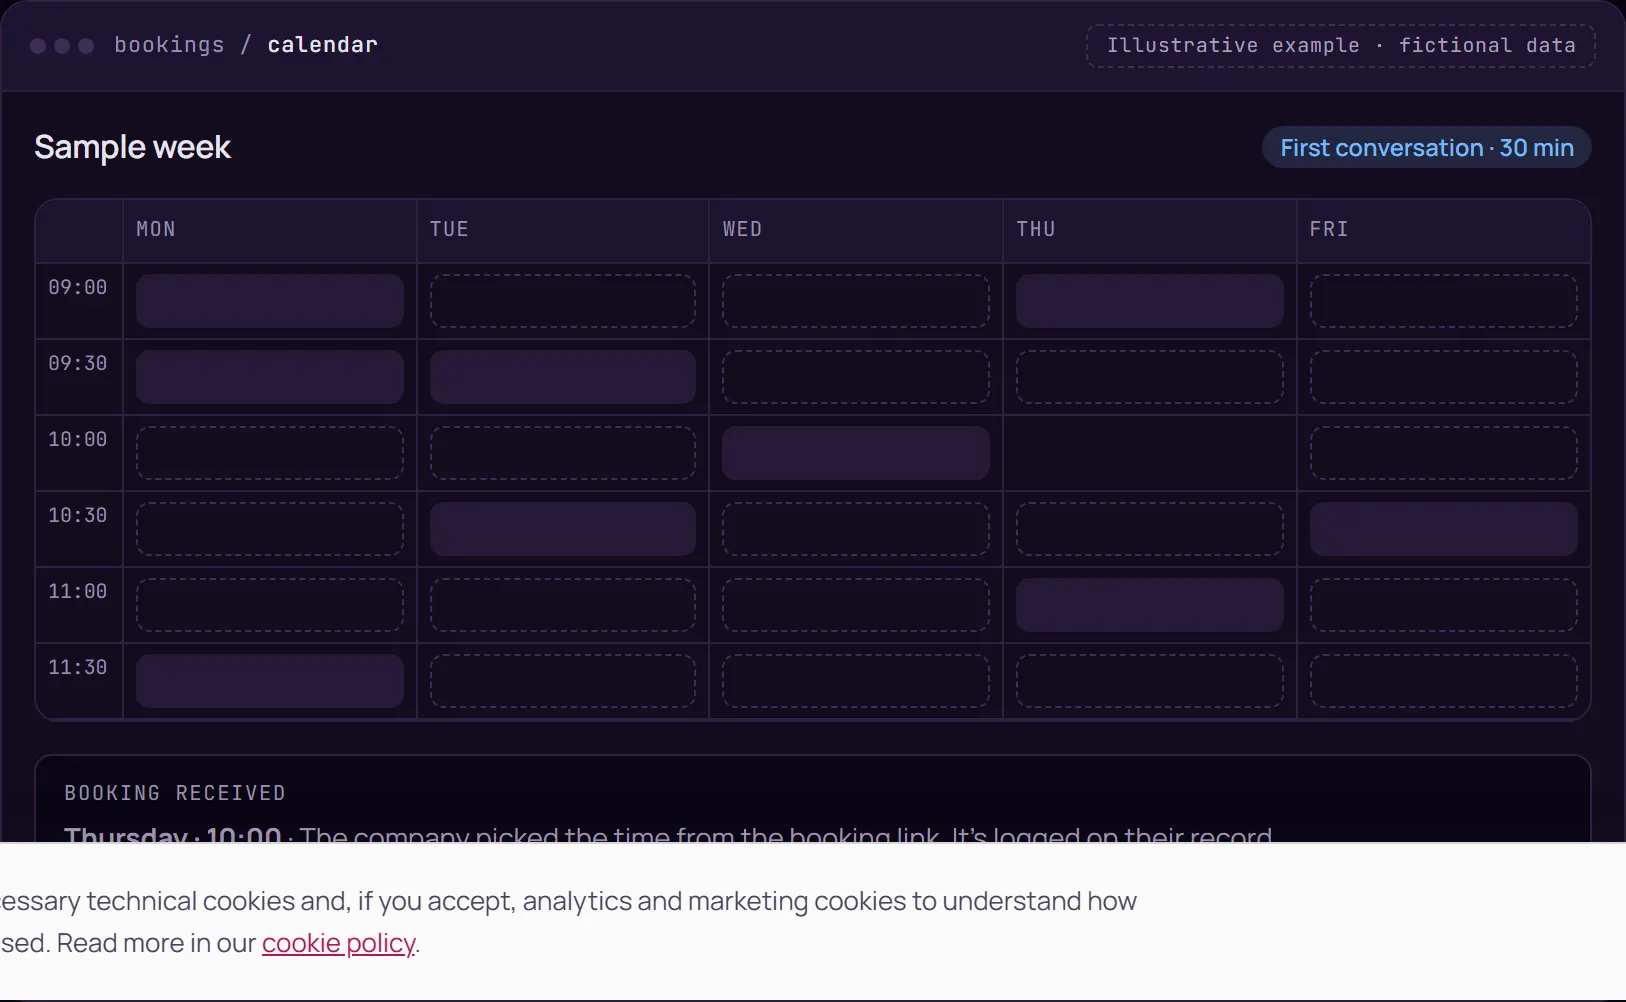
Whoever wants to talk opens a link, sees the open times and books one. The meeting shows up on the calendar and on their company's record.

What the team doesSets up the meeting types and keeps availability current.
What you do or seeYou get the meeting already on the calendar.
Illustrative example of the booking calendar: a week with open times, busy times and one 30-minute meeting booked. Fictional data.Illustrative example of the booking calendar: a week with open times, busy times and one 30-minute meeting booked. Fictional data.
Screen 04 · Booking calendarIllustrative example · fictional data

05 · Report by link

Your metrics, in one link.

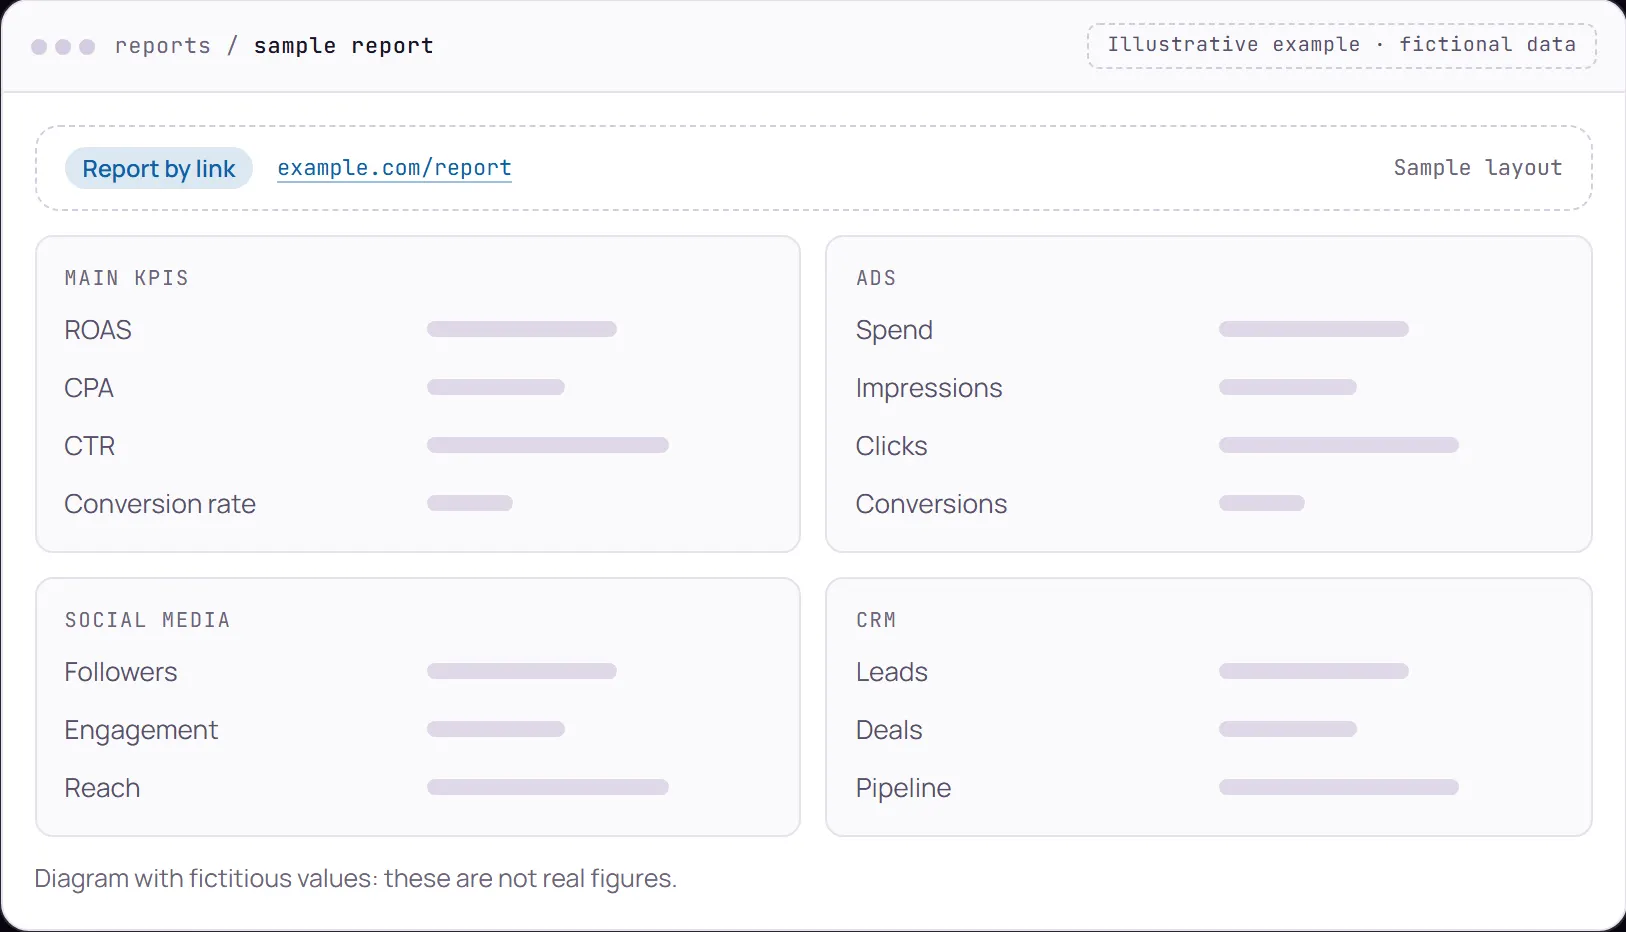
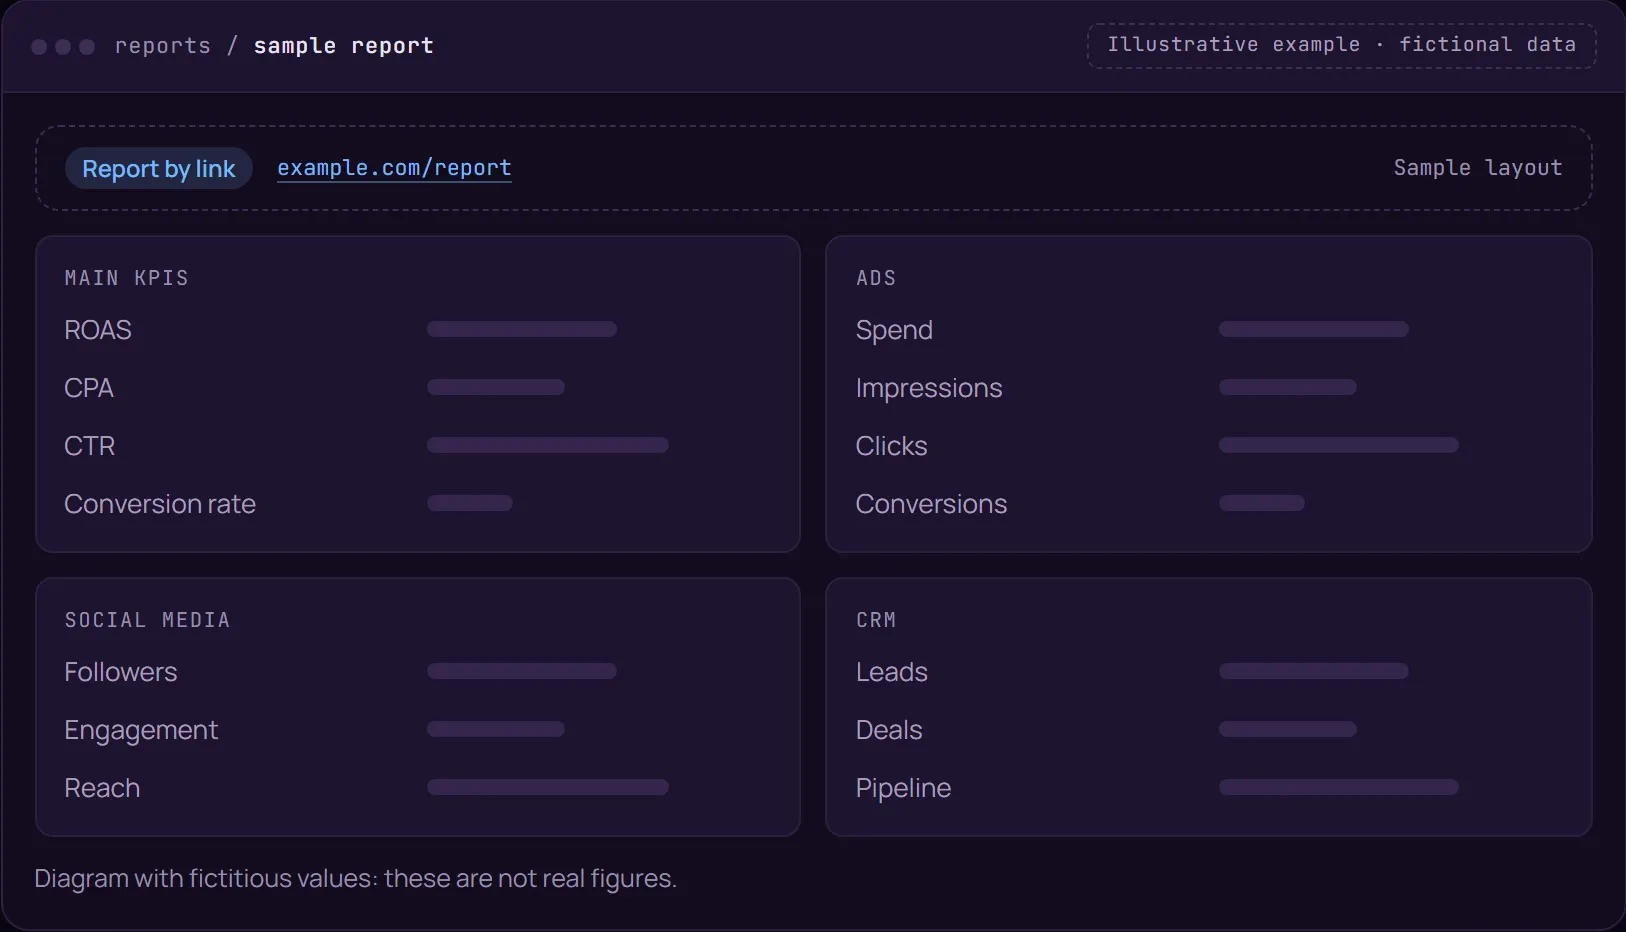
A report that opens from a link, with nothing to install: main KPIs, ads, social media and CRM.

What the team doesPrepares it and shares it by link.
What you do or seeYou open it whenever you like, no need to ask.
Illustrative example of a report by link with metrics: main KPIs, ads, social media and CRM. Diagram with fictitious data.Illustrative example of a report by link with metrics: main KPIs, ads, social media and CRM. Diagram with fictitious data.
Screen 05 · Report by linkIllustrative example · fictional data

06 · Signal console

Where it all starts.

The Signal Engine gathers what it finds in public sources and sorts it by company. The rule is simple: if a data point has no link and no date, it doesn't get in.

What the team doesFilters, checks every source and decides what moves on to outreach.
What you do or seeYou see the evidence behind every company we suggest.
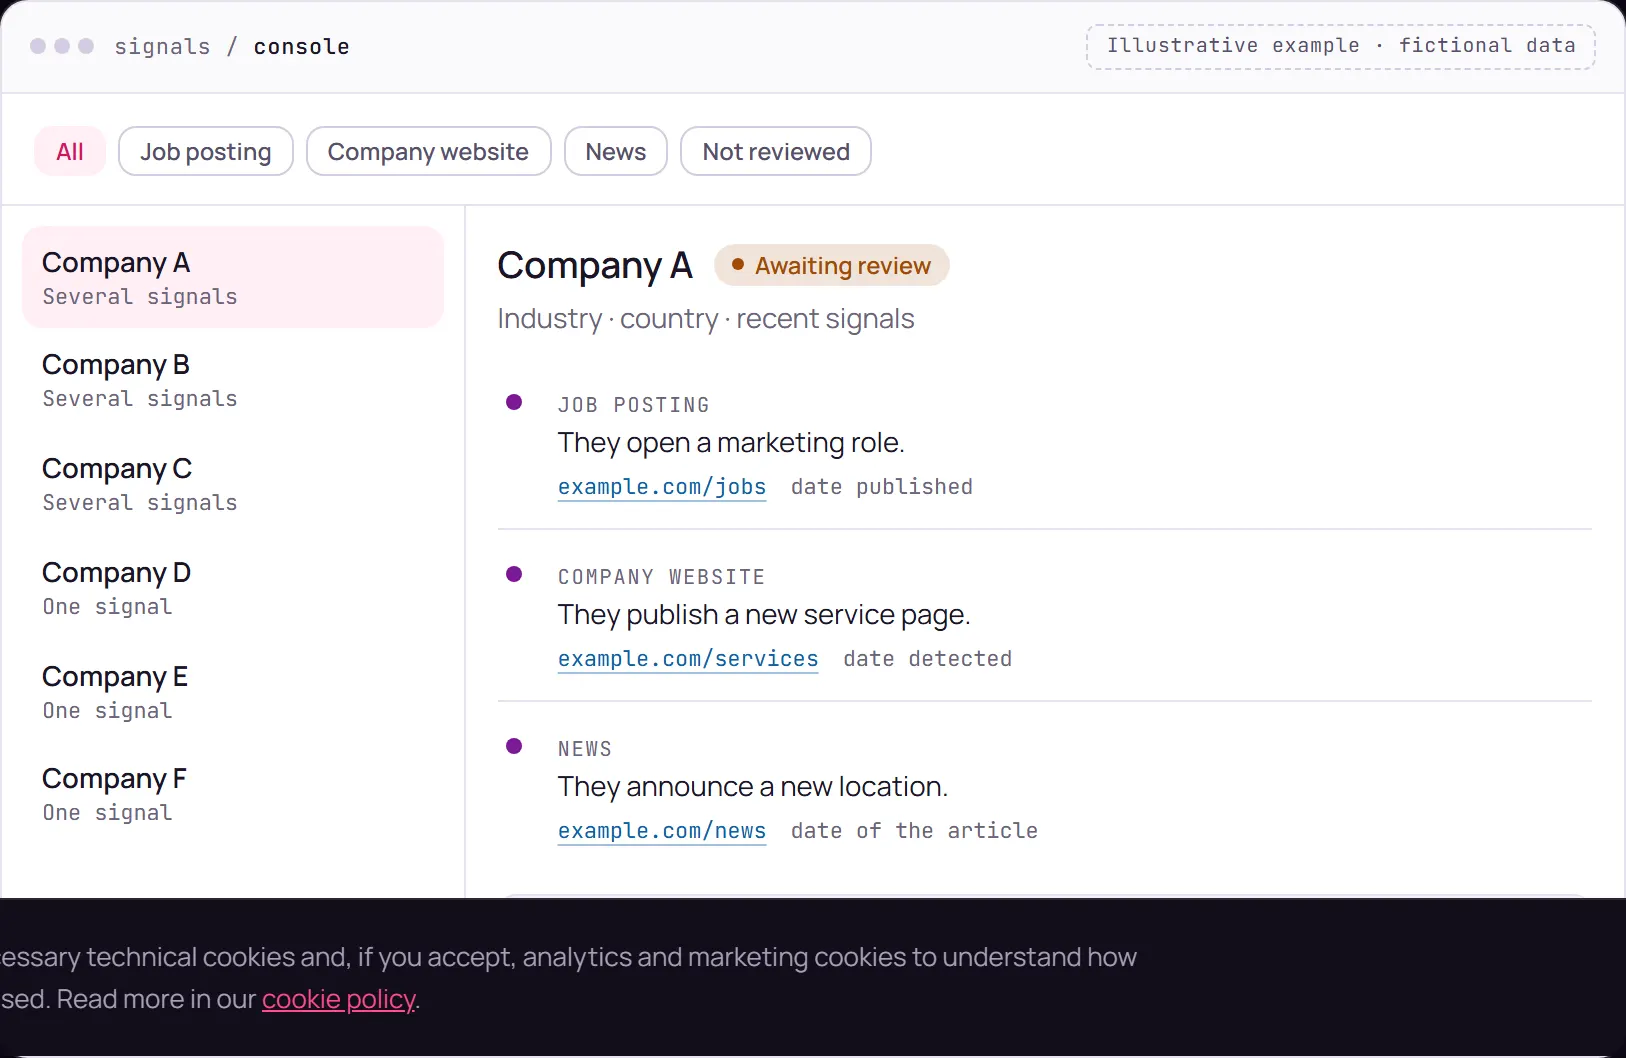
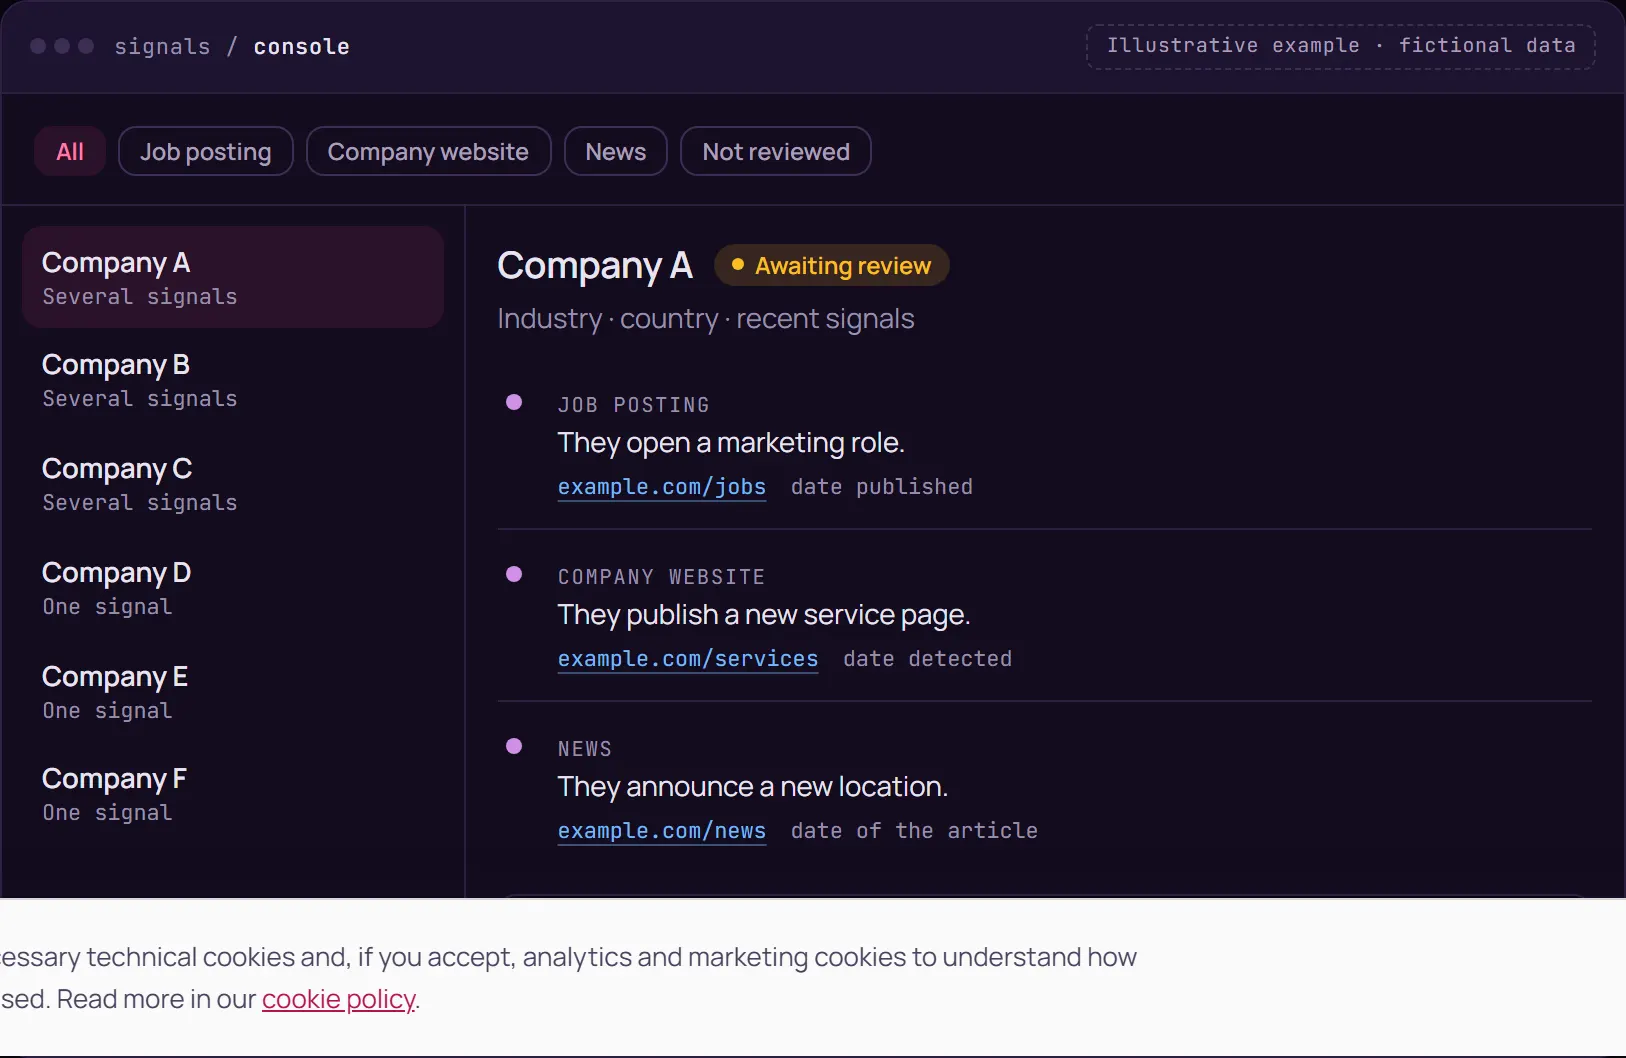
Illustrative example of the signal console: filters by signal type, a list of accounts and, for the selected account, each signal with its source, link and date. Fictional data.Illustrative example of the signal console: filters by signal type, a list of accounts and, for the selected account, each signal with its source, link and date. Fictional data.
Screen 06 · Signal consoleIllustrative example · fictional data

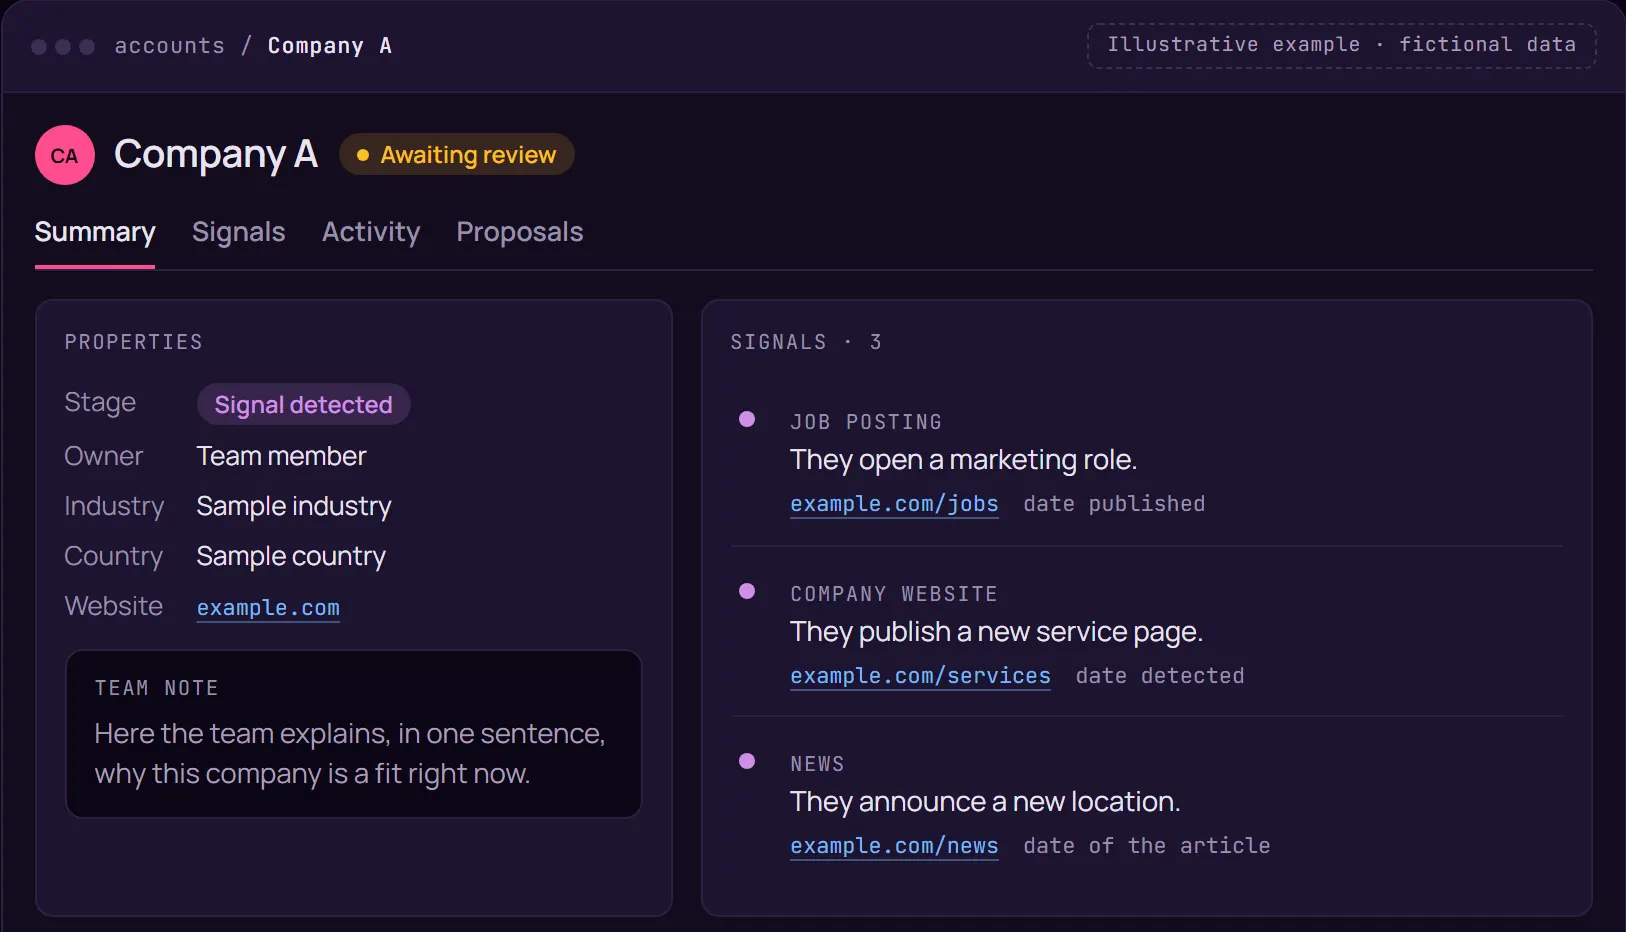
Illustrative example of an account record: company properties, three signals with source and date, and activity in order. Fictional data.Illustrative example of an account record: company properties, three signals with source and date, and activity in order. Fictional data.

A record gathers what we know about a company and where it comes from. The pattern is always the same: what was detected, in which source, on what date. Activity is logged below, in order.

What the team does Reviews the signals and writes the note explaining why it's a fit.

What you do or see You read the reason before anyone gets a message.
Review queueReview queue

Ads, articles, posts and emails can go through a review queue, where a person approves or rejects each piece.

What the team does Prepares each piece and leaves it ready for review.

What you do or see With review switched on, you approve or reject anything that carries your name, with your point of contact.

Illustrative example of the pipeline by stage: five columns, from signal detected to proposal sent, with the companies in each stage. Fictional data.Illustrative example of the pipeline by stage: five columns, from signal detected to proposal sent, with the companies in each stage. Fictional data.

Companies move across columns, from first signal to proposal. At a glance you can see what's stalled and whose move it is.

What the team does Moves each contact from stage to stage and notes the next step.

What you do or see You know where every conversation stands.

Illustrative example of the booking calendar: a week with open times, busy times and one 30-minute meeting booked. Fictional data.Illustrative example of the booking calendar: a week with open times, busy times and one 30-minute meeting booked. Fictional data.

Whoever wants to talk opens a link, sees the open times and books one. The meeting shows up on the calendar and on their company's record.

What the team does Sets up the meeting types and keeps availability current.

What you do or see You get the meeting already on the calendar.

Illustrative example of a report by link with metrics: main KPIs, ads, social media and CRM. Diagram with fictitious data.Illustrative example of a report by link with metrics: main KPIs, ads, social media and CRM. Diagram with fictitious data.

A report that opens from a link, with nothing to install: main KPIs, ads, social media and CRM.

What the team does Prepares it and shares it by link.

What you do or see You open it whenever you like, no need to ask.

Illustrative example of the signal console: filters by signal type, a list of accounts and, for the selected account, each signal with its source, link and date. Fictional data.Illustrative example of the signal console: filters by signal type, a list of accounts and, for the selected account, each signal with its source, link and date. Fictional data.

The Signal Engine gathers what it finds in public sources and sorts it by company. The rule is simple: if a data point has no link and no date, it doesn't get in.

What the team does Filters, checks every source and decides what moves on to outreach.

What you do or see You see the evidence behind every company we suggest.

How we work

A system that finds, attracts and converts customers.

  1. 01 · Find · our own Signal Engine

    We know who to talk to, and why.

    Our Signal Engine reads public sources and spots companies at a moment when what you offer is useful to them: an open role, a new service, a new location.

    More detail

    Every data point comes with its source and its date. A person reviews it before we propose a contact to you.

  2. 02 · Attract

    Be found by people already looking.

    Ads, search, content and your website work as one: whoever searches for what you do lands on a page built for that search.

  3. 03 · Talk

    Every contact, followed up.

    Scattered signals become organized conversations. Every contact has a stage and a next step, so follow-up no longer depends on someone remembering.

  4. 04 · Convert

    From conversation to customer.

    Not every conversation ends in a customer. The system is there so they don't slip away through neglect, and so you know where each one stands.

What a person decides

What the platform doesn't do on its own.

  • It doesn't decide who's a fit

    It sorts the signals and shows the evidence. The judgment is a person's.

  • It doesn't book on anyone's behalf

    The other person picks the time from a link.

  • It doesn't send automated LinkedIn messages

    There is a review queue where a person can approve sends.

  • It is not a real-time dashboard

    The report by link shows ads, social and CRM metrics. Read-only client access is in development.

Contact

Shall we look at your case?

In 30 minutes we'll show you how we work and figure out which piece to start with.